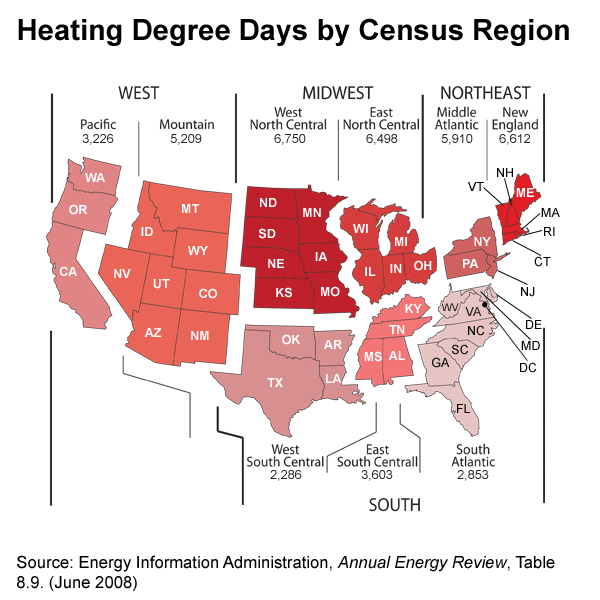
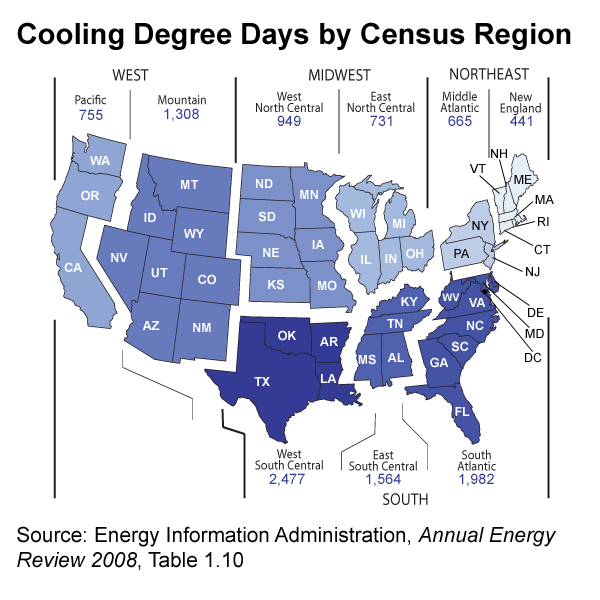
Freezing winter weather or a long, sweltering summer — either one increases your utility bills. But how much of the rise in the cost is a result of the weather? You can find out by using a unit of measure called the "degree-day." A degree-day compares the outdoor temperature to a standard of 65°F; the more extreme the temperature, the higher the degree-day number and the more energy needed for space heating or cooling.
Hot days, which require the use of energy for cooling, are measured in cooling degree-days. On a day with a mean temperature of 80°F, for example, 15 cooling degree-days would be recorded. Cold days are measured in heating degree-days. For a day with a mean temperature of 40°F, 25 heating degree-days would be recorded. Two such cold days would result in a total of 50 heating degree-days for the two-day period.

What Is Degree-Day Data Used For?
By studying degree-day patterns in your area, you can evaluate the increases or decreases in your heating or air-conditioning bills from year to year.

Where Can I Find Degree-Day Data?
In some areas, degree-day information is published in the local newspapers, usually in the weather section. Degree-day information may also be available from your local utility and its public relations department. Some utility bills even show degree-days for each billing period.
The U.S. Energy Information Administration publishes regional averages for:
- Heating Degree-Days
- Cooling Degree-Days
What Is Normal for Each Region?
The degree-day maps show the population-weighted degree-days that normally occur in each region of the United States.


