What is GLOBIO?
GLOBIO is a modelling framework to calculate the impact of five environmental drivers on land biodiversity for past, present and future.
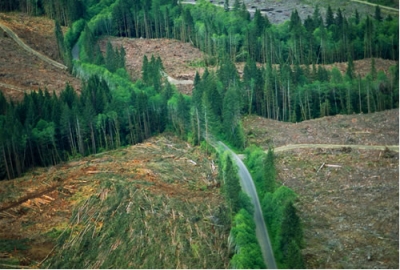
Land use, here forestry, is one of the environmental drivers impacting biodiversity.
GLOBIO is based on cause-effect relationships, derived from the literature. To use GLOBIO no detailed species data are needed. Instead, the model uses spatial information on environmental drivers as input. This input is mainly derived from the Integrated Model to Assess the Global Environment (IMAGE).
The current version of GLOBIO, GLOBIO3, focuses on the terrestrial part of the globe. A module for the freshwater aquatic environment is under development (GLOBIO-aquatic). The Sea Around Us Project of the University of British Colombia (UBC) has developed a similar model for marine ecosystems: EcoOcean.
The information under this menu item refers to the current version of the model: GLOBIO3.
How it works
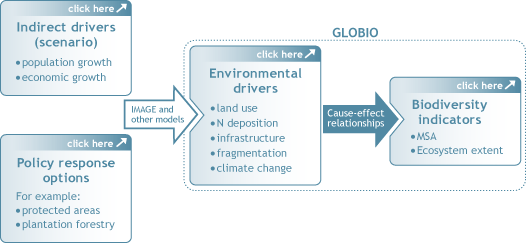
A DPSIR framework is the basis underlying the GLOBIO model (see figure). The major indirect drivers are population growth, economic growth and technology. They cause the change in environmental drivers such as land use, atmospheric nitrogen deposition etc. Policy response options, such as protected areas and plantation forestry, can mitigate these pressures. The environmental drivers in turn drive the changes in biodiversity.
Scenarios
GLOBIO has been designed to evaluate future developments before they occur.
In this line of work, it is customary to cluster future developments in a ‘scenario’. A scenario is a plausible combination of developments in fundamental (indirect) drivers of change, such as demography, technology, labour productivity and political mood. In other words, the term ‘scenario’ is used as shorthand for a set of interrelated changes over time.
For global analyses GLOBIO uses scenarios such as the SRES scenarios developed for the Intergovernmental Panel on Climate Change (IPCC), scenarios from the Global Environmental Outlooks of UNEP, scenarios developed for the Millennium Ecosystem Assessment and scenarios developed by OECD.
Sub-global scenarios
For sub-global analyses the global scenarios can be refined for specific areas and countries. Also simple, new scenarios can be designed. Information to underpin the scenario can be extracted from national statistical resources, development plans, visions, the Global Forest Resource Assessment etc. Preferably also local experts are consulted.
Policy options
New and existing policy response options can be evaluated by GLOBIO, mostly in combination with other models such as IMAGE or CLUE. GLOBIO analyzes the potential effectivity of options assuming full implementation. Consequently, different options can be compared.
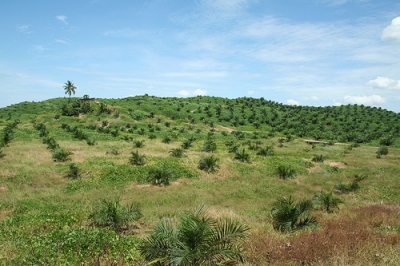
Palm oil plantation. Photo: Angela Sevin
For example, the following policy response options were explored for the second Global Biodiversity Outlook (see also the report Cross-roads of Life on Earth):
- Liberalization of agricultural markets
- Poverty reduction
- Limiting climate change
- Sustainable meat production
- Plantation forest
- Protected areas
Regional options
GLOBIO can be used to analyze global policy options, but also options at regional and national scales. An example is the implementation of networks of protected areas.
Environmental drivers
In GLOBIO environmental drivers are broad categories of factors that influence biodiversity directly. The term 'environmental drivers' is synonymous with ‘direct drivers’ as used in the Millennium Ecosystem Assessment (2005) and ‘pressures’ in the Driver – Pressure – State – Impact – Response framework.
GLOBIO is based on five global environmental drivers of biodiversity change:
- Land use (including agriculture, forestry and urbanisation)
- Atmospheric nitrogen deposition
- Infrastructure
- Fragmentation
- Climate change
Spatial information (maps) on these drivers forms the input of GLOBIO. For analyses on the global scale an important part of the input is generated using the Integrated Model for Assessment of the Global Environment (IMAGE). Based on scenarios and policy options, IMAGE simulates present and future status of the drivers. However, although GLOBIO has a strong relation with IMAGE, it is equally well possible to examine the impact of drivers simulated by other models.
1. Land use
Land use has an impact on biodiversity through the qualitative and quantitative loss of natural elements and natural vegetation in the agricultural landscape. It is not only the type of land use which matters, but also the intensity of use. In GLOBIO land use is categorised in 10 classes:
- Primary vegetation
- Lightly used forest
- Secondary forest
- Forest plantations
- Livestock grazing
- Man-made pastures
- Agroforestry
- Low-input agriculture
- Intensive agriculture
- Urban areas
Present state land use maps for GLOBIO are generated on the basis of land cover maps, such as GLC2000. The land cover maps are combined with various other data sources on land use intensity, such as data from FAO and national data. To project future land use often the IMAGE model is used, but also other models can be applied. For national and regional analysis often the model CLUE is used to obtain more detailed output data.
2. Atmospheric nitrogen deposition
Atmospheric nitrogen deposition is included in GLOBIO using the critical load concept. Deposition above certain levels causes a negative effect on biodiversity. IMAGE is used to simulate present and future levels of N-deposition.
3. Infrastructure
In GLOBIO infrastructure comprises roads and railroads. It has a direct and an indirect effect on biodiversity. Direct, because many animal species tend to avoid roads, being disturbed by the traffic or are unable to cross roads and railroads. Indirect, because infrastructure can attract a lot of other activities around it, such as human settlement, hunting and recreation.
In GLOBIO, the main source of the present state map on infrastructure is the Digital Chart of the World.
4. Fragmentation
GLOBIO includes the effects on fragmentation in terms of the effects of patch size on biodiversity. Distance between patches is not included.
For the present state, GLOBIO input on fragmentation is calculated from land cover maps, such as GLC 2000. Patch size is calculated for natural areas, i.e. all land cover categories except urban area and cropland. For scenario-analyses future patch size is based on simulations of land use change.
5. Climate change
Climate change affects biodiversity by causing shifts in distribution ranges. The driver is included in GLOBIO using the Global Mean Temperature Increase (GMTI), an important variable in climate change scenarios. Present and future state of GMTI are simulated with IMAGE.
GLOBIO: cause-effect relationships
The core of GLOBIO is a set of cause-effect relationships. For each of the five drivers included, the model contains a regression equation, linking the intensity of the pressure to the impact on biodiversity. The impact is captured in terms of the biodiversity indicator MSA: the mean abundance of original species, compared to the undisturbed situation.
The GLOBIO regression equations are based on nearly 200 peer reviewed references on the response of species to change in the environment, i.e. the drivers.
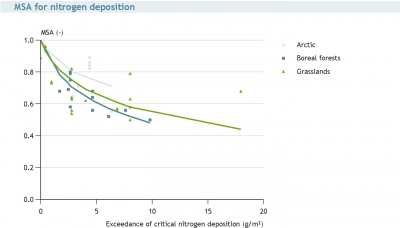
The output indicator 'Ecosystem extent' is directly derived from the models providing input for GLOBIO (e.g. IMAGE).
Impact on biodiversity
The output of GLOBIO can basically be expressed in various biodiversity indicators. At the moment, the main indicators used are the Mean Species Abundance (MSA) and Ecosystem extent.
Mean Species Abundance
MSA is an indicator of naturalness or biodiversity intactness. It is defined as the mean abundance of original species relative to their abundance in undisturbed ecosystems. An area with an MSA of 100% means a biodiversity that is similar to the natural situation. An MSA of 0% means a completely destructed ecosystem, with no original species remaining.
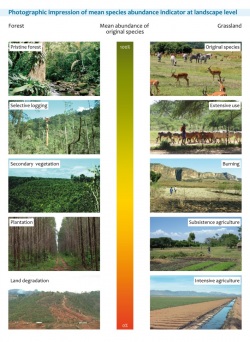
MSA gradient for forest and grassland, illustrated with images
We emphasize that MSA does not completely cover the complex biodiversity concept. Complementary indicators should be included, when used in extensive biodiversity assessments. The GLOBIO team is currently exploring options to model additional indicators.
Calculation
The MSA is calculated by:
- Calculation of MSA per driver, using the cause-effect relationships, per grid cell of the map
- Combining the MSA value of all drivers to a total MSA per grid cell
- Aggregation across grid cells, e.g. towards global or regional MSA values
The output resolution depends on the input maps. For global analyses the resolution is 0.5 by 0.5 degree (nearly 55km2 near the equator). For national analyses often 1 by 1 km is used.
Similar indicators
MSA can be considered a proxy for the CBD indicator on trends in species abundance. MSA is similar to the Biodiversity Integrity Index, the Biodiversity Intactness Index (BII) and the Living Planet Index (LPI).
The main difference between MSA and BII is that every hectare is given equal weight in MSA, whereas BII gives more weight to species rich areas.
The main difference with LPI is that MSA takes the pristine situation as a baseline, whereas LPI compares to the situation in 1970.
Ecosystem extent
Ecosystem extent is defined as the original area of a biome minus the area occupied by agricultural and urban land use. Ecosystem extent is calculated with models such as IMAGE at global level or CLUE at national or regional levels.
Science behind GLOBIO
The core of the GLOBIO model is a set of cause-effect relationships, describing the impact of five environmental drivers on biodiversity.
The drivers are:
- Land use
- Atmospheric nitrogen deposition
- Infrastructure
- Fragmentation
- Climate change
Meta-analysis
For each driver the cause–effect relationship is based on a quantitative synthesis of peer-reviewed literature (meta-analysis). Nearly 200 empirical studies were used on species composition in disturbed and undisturbed situations. Major species groups covered by these studies are birds, plants, mammals, reptiles and insects. For each study, values for the biodiversity indicator MSA were calculated:
- The abundance of each species, recorded as density, numbers, or relative cover, found in disturbed situations was divided by its abundance found in undisturbed situations.
- These values were truncated at 1.
- The mean and variance were calculated for all species considered in that study.
- Species not found in undisturbed vegetations were omitted.
Note that individual species responses are not modelled in GLOBIO. MSA represents the average response of the total set of species belonging to an ecosystem.
Quality of results
The global biodiversity model GLOBIO has a sound scientific basis and is continuously exposed to scientific scrutiny. The cause-effect relationships, which form the core of GLOBIO, are based on nearly 200 peer-reviewed references.
In 2005 a review panel of international scientists, lead by prof. dr. Rik Leemans (Wageningen UR, The Netherlands), concluded that the GLOBIO approach is scientifically sound and fit for its purpose.
In 2009 the GLOBIO modelling framework was published in the peer-reviewed scientific journal Ecosystems.
How to interpret and judge GLOBIO results
Like all models, being abstractions of reality, also the GLOBIO model has its limitations. First of all: GLOBIO output maps and graphs on the status and trends of biodiversity should not be seen as absolute values, but rather be interpreted in a relative way. This means: comparing baseline scenarios and policy response options, comparing regions or tracking change over time.
Furthermore, when judging the quality and validity of GLOBIO modelling results, the following aspects should be taken into account:
- Drivers (not) included
- Quality of input data
- Quality of the GLOBIO cause-effect relationships
- Selection of output indicators
New developments
The GLOBIO model is continuously under further improvement and development.
In 2010 major areas of work are:
- Aquatic ecosystems
- Species modelling (information follows)
- Infrastructure (information follows)

Fisheries is one of the environmental drivers impacting biodiversity of aquatic ecosystems.
History of GLOBIO
The origins of the present GLOBIO model (GLOBIO3) go back to the GLOBIO2 model and the Natural Capital Index-IMAGE framework (NCI-IMAGE). Both approaches are universal, policy oriented frameworks on the impact of human activities on biodiversity.
To meet the challenge of evaluating the global targets on biodiversity, an international consortium, made up of the UNEP World Conservation Monitoring Centre, UNEP GRID-Arendal and the Netherlands Environmental Assessment Agency joined forces in 2003. They combined the GLOBIO2 and the IMAGE-NCI approach into a new Global Biodiversity Model: GLOBIO3. This model is in use since 2005.
GLOBIO2
The GLOBIO2 model was developed in 2001 at UNEP GRID-Arendal, Norway. GLOBIO2 was based on published field data to predict the impact of infrastructure development on species diversity.
The infrastructure module of the current GLOBIO version (GLOBIO3) is entirely based on GLOBIO2.
Assessments with GLOBIO2
From 2002 – 2005 GLOBIO2 has been used for several global and regional environmental assessments of UNEP:
- Vital arctic graphics (2005)
- Arctic environment: European perspectives (2004)
- Mountain watch (2002)
- Great apes, the road ahead (2002)
Natural Capital Index-IMAGE
The Natural Capital Index (NCI) was developed by the Netherlands Environmental Assessment Agency as a contribution to the implementation of the Convention on Biological Diversity. Development started in 1996. NCI was a biodiversity indicator representing the relative abundance of original species, compared to a postulated baseline, set in pre-industrial times. NCI was originally designed to be based on monitoring data.
For future outlooks, a pressure-based NCI was developed, calculating the remaining species abundance based on projections of environmental drivers (land use and climate change). The IMAGE model became an important supplier of input data on drivers.
NCI has been proposed as candidate indicator in various CBD documents on biodiversity indicators. In the Biodiversity Indicators for National Use project (BINU), financed by the Global Environmental Facility (GEF), NCI has been tested in various countries.
NCI was later slightly adjusted to the requirements of modeling in global assessments and renamed Mean Species Abundance (MSA). MSA is the biodiversity indicator modelled by GLOBIO3.
Assessments with NCI-IMAGE
Between 1997 and 2002 the NCI-IMAGE framework has been applied in various assessments from global to regional and national scale:
- UNEP’s first and third Global Environment Outlook (1997 and 2002)
- The European Environmental Priorities report (2000)
- OECD Environmental Outlook and Strategy (2000; feasibility study)
- Dutch Nature Outlook 2 (2002), where NCI was implemented as core indicator


